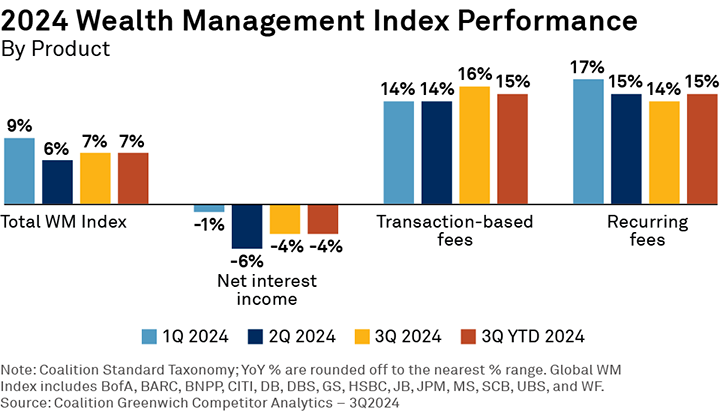
Increased demand for alternatives, structured products and cash products helped push growth for global wealth managers to 7% in the first three quarters of 2024.
From 2022 to 2023, performance among global wealth managers was driven by increasing net interest income, which was offset by declines in transaction-based and recurring fees. Those trends began to reverse in 2H23 and continued into 2024. Through the first nine months of 2024, strong investor demand overcame the negative impact of declining interest rates to push growth higher.

The Coalition Greenwich WM Index, which covers 14 wealth managers globally, grew by 7% 3QYTD:
- Net interest income declined by 4% from deposit margin compression, partially offset by growth in non-sweep deposits and loan balances. Deposit balances improved significantly YoY while loan balances improved modestly in 2Q and 3Q, driven by ultra-high-net-worth (UHNW) and high-net-worth (HNW) mortgage lending.
- Transaction-based fees increased by 15%, driven by demand namely in the U.S., Asia and Switzerland for structured products, alternatives and fixed income. 3Q saw significant improvement in advisor-led channels.
- Recurring fees increased by 15% YoY on the back of higher asset levels and the cumulative effects of positive fee-based flows in 2023. In particular, U.S. and Europe Index WMs benefited from inflows from the local U.S. and Credit Suisse bank failures in 1H23.
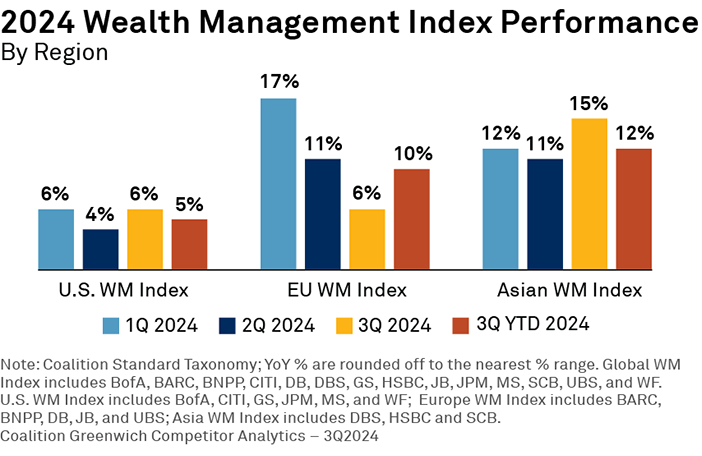
Regional Differences: Asia and Europe WM Index Outperforming U.S. WM Index

Regionally, U.S. WMs are the most sensitive to interest rate changes and market movements. This has led to the U.S. WM Index outperforming in 2022 and 2023 but underperforming in 2024. YTD 2024 growth of 5% was driven by higher market levels and increased brokerage activity amid Fed rate cuts and higher pricing of sweep deposits.
In contrast, Asian WMs tend to tie their wealth management services to their strong retail banking business, and clients are more executionary in nature. That means stickier net interest income and a higher proportion of transaction fees. Asia WM Index 3Q transaction-based fees increased by 45% YoY, driven by strong brokerage and trading from the economic stimulus in China and higher sales of mutual funds, structured products, and bonds.
Meanwhile, YTD growth for the Europe WM Index of 10% was driven by growth in assets under management (AUM) and increased demand in structured and cash products. It also benefited from UHNW inflows from Credit Suisse in 2023, as private banking clients looked to diversify their exposure.
Where Are Wealth Managers Investing?
Overall, the majority of wealth managers in our Index have a strategy of targeted growth: focusing on the markets and wealth segments that they’re strongest in, rather than the broad-based growth we saw before interest rate rises.
- Wealth management divisions are increasingly collaborating with their investment banking division to strengthen their UHNW propositions.
- Growth in LatAm is slowing, while Europe and Asia WMs are expanding their presence in the Middle East, especially targeting non-resident Indians and Middle Eastern clients with international banking needs.
- Index WMs are heavily investing in AI to boost sales and support capabilities.
- The U.S. WM Index is mainly focusing on the HNW segment, whereas the Asian WM Index is focusing on the Affluent segment.
Looking forward to 1H25, we expect wealth managers to have single-digit growth due to the continued global economy and markets rebound. We expect U.S. and North Asia to outperform, and family offices and UHNW individuals to benefit from their globally diversified portfolios.
Grace Miu, Research Manager on the CIB Competitor Analytics team, is the author of this report.
