


Volume
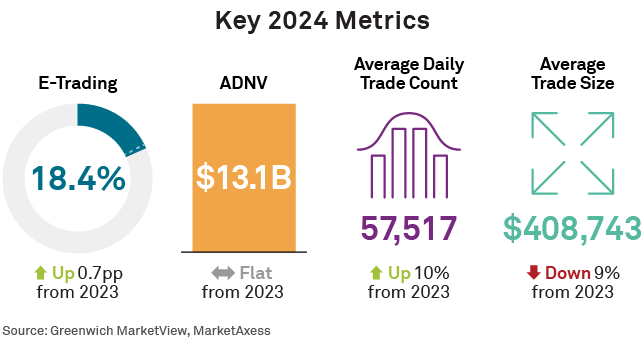
Municipal bond trading activity remained robust in 2024 with an average daily notional volume (ADNV) traded of $13.1 billion. This trading activity matched 2023 and was slightly down from 2022, but was still nearly 50% higher than pre-rate hike 2021. A 32% growth in new issuance to $508 billion1 and net mutual fund/ETF inflows of $45.7 billion kept traders busy throughout the year.
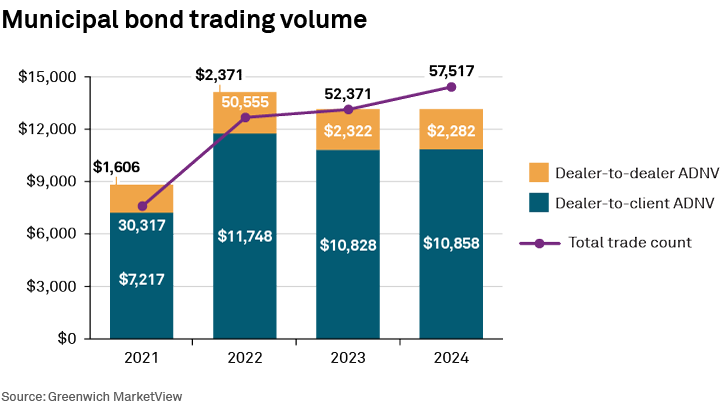
The average daily trade count hit a record in 2024, reaching 57,517—a nearly 10% year-over-year increase. The growth of muni separately managed accounts (SMAs) and electronic trading adoption both played a part, with one supporting the growth of the other. Muni assets in SMAs grew an impressive 14% year over year to $1.6 trillion, according to Bloomberg data, reversing a 5% year-over-year decline in 2023. SMA assets managed by retail-focused managers grew faster than institutional SMAs, with the former now accounting for 53% of assets, up from 45% in 2019. Retail investors are drawn to shrinking account minimums and active management, while wealth managers enjoy earning fees higher than the nearly zero they generate from index-tracking ETFs.
While yields approaching forward-looking equity market returns are the main drive of investor demand, the electronification of the market is what has allowed SMA adoption by the high-net-worth masses. E-trading and related technology has allowed fully automated management of these accounts in some cases, where portfolios can be rebalanced and the needed changes executed with little or no human intervention. This creates a high-value service for investors and a low cost of doing business for managers.
Electronic trading
While SMA expansion was facilitated by e-trading’s growth in the muni market, some of e-trading’s growth in the last two years can be attributed to the growth of SMAs. E-trading accounted for 18.4% of notional volume traded in 2024, compared to 17.7% in 2023. A growing number of dealers are auto-quoting an increasingly large list of muni CUSIPs while the bleeding-edge buy-side firms are trading more volume via EMS front ends connected to liquidity venues via API. And while the move upward in e-trading is small in percentage terms, such growth is similar to the trajectory of the corporate bond market over the past decade, where e-trading now accounts for 44% of volume.

The likely reason for the Q4 jump in e-trading levels in 2023 and 2024 is also worth noting. In September 2023, the Fed paused its rate-hiking cycle, which was then followed two months later by lower than expected inflation prints. In late 2024, we saw the first Fed rate hike in several years, alongside Presidential election and inflation news. In both cases, market activity picked up notably due to the change and/or uncertainty. Immature electronic markets generally see volume retreat to the phone when markets get busy, but that is not what we saw in munis these past two years, with e-trading peaking in both years in Q4, which suggests more of the same is to come.
Platform market share
Unsurprisingly, there is fierce competition to capture this e-trading growth and encourage more of it. While the market share picture changed little year-over-year, we cannot assume past performance guarantees future results.
Bloomberg handled 45% of e-traded volume in 2024 as the largest volume player. Their activity is nearly all institutional dealer-to-client trading. The majority of the buy side uses the MBW screen, and most dealers supply prices via API. Entering quotes into MBWD via point-and-click doesn’t cut it anymore.
ICE Bonds (still often referred to as TMC) and Tradeweb collectively control the retail market, although we’re seeing more institutional traders tap into these liquidity pools for quick, click-to-trade liquidity. Although our research suggests ICE’s ADNV is slightly ahead of Tradeweb’s, Tradeweb reported the best year-over-year volume growth in 2024 at just over 6%. Click-to-trade is becoming a better label for this market segment than “retail” or “odd-lots,” as institutional dealers are increasingly providing liquidity here, while institutional managers are finding that click-to-trade liquidity nicely supplements block-trading via RFQ.
Interestingly, Bloomberg muni users can access liquidity from both ICE and Tradeweb in MDW, with the top-of-book prices on those markets listed alongside those of other brokers. This means trades executed on ICE or Tradeweb via Bloomberg are “counted” by both platforms as volume, which is technically correct. Nevertheless, data suggests this activity accounts for a relatively small amount of total e-volume, and so is more-or-less inconsequential when thinking about total e-trading levels.
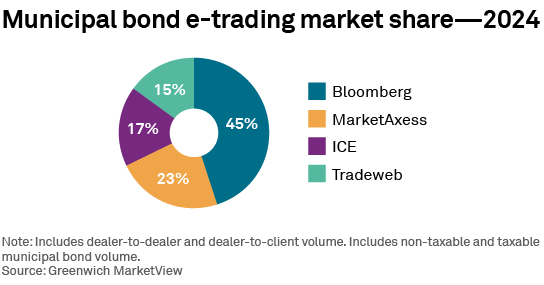
MarketAxess’ offering includes dealer-to-client and dealer-to-dealer liquidity pools, the latter of which was boosted by their acquisition of MuniBrokers in 2020. Also worth noting, roughly 43% of their notional trading volume is in taxable munis,2 up from about 38% in early 2021. To put that in perspective, taxable munis represent about 10% of all muni CUSIPs today. MarketAxess’ successful history in all-to-all trading suggests its muni markets could benefit from a similar approach over time. And keeping with the market linkages theme we just discussed, MarketAxess’ deal with ICE allowed both platforms to route orders to the other if the given client’s best outcome is to be had on the other platform.
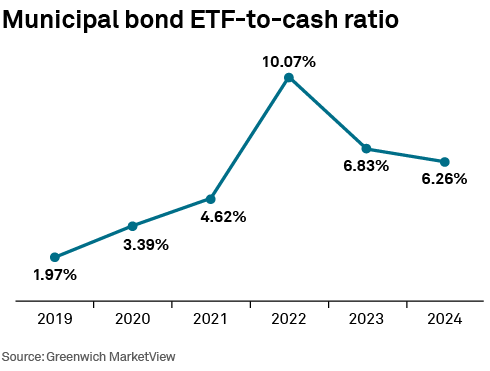
ETFs
The role of ETFs as a trading vehicle in the muni market is small but growing. We can see this by measuring the notional equivalent volume of the largest muni ETFs and dividing that by the volume traded in the underlying muni market—the ETF-to-cash ratio. While this metric has actually dropped over the past two years, we see 2022 as an anomaly and focus on the growth from 2% in 2019 to over 6% in 2024. Inflows into muni ETFs do play a part in trading volume, as does general market volatility. But the real catalyst will be the entrance of more systematic market makers using ETFs and the create-redeem process to manage risk and facilitate market making activity, similar to what we’ve seen in credit markets. This would improve muni ETF liquidity, which would further encourage asset managers to use ETFs as a tool to get beta exposure while seeking out the bonds they need or to put on a quick hedge. Over the longer term, a liquid options-on-muni-ETFs market could also offer a much needed shorting mechanism.
2025
The electronification of the muni market is underway and will continue in the year ahead. History suggests that growth is generally slow and steady, but market shocks, strong investor demand for workflow improvements and trading protocol innovation from trading venues can all cause surges in growth. In Muniland, its always necessary to mention the million CUSIP problem, which suggests that the universe is so big that only a small portion could ever qualify as truly liquid. However, other fixed-income markets have shown that even illiquid bonds can be traded more efficiently via electronic means, even if only one buyer and one seller exist in the world. Expect to see more innovation in that workflow in the years ahead.
Talk of removing the tax-exempt status of the muni market has grown as the new administration in Washington works toward a new tax bill. While those we’ve heard from think the likelihood of this is low, the probability remains non-zero and so must be taken seriously. Munis without a tax exemption look almost like corporate bonds. There is nothing inherently wrong with that, although it could lessen the demand for existing and future muni issues if they have no way to stand out in a crowded field.
Market Structure & Technology Head of Research Kevin McPartland and Associate Vice President Neha Jain are co-authors of this report.
1MSRB – https://www.msrb.org/sites/default/files/2025-01/MSRB-2024-Municipal-Market-Year-in-Review.pdf
2MarketAxess – https://s201.q4cdn.com/767283836/files/doc_financials/2024/q3/3Q_2024-Earnings_Deck_Final.pdf
The data underlying this analysis, which includes but is not limited to e-trading levels, platform market share and total market volumes, is available to subscribers of Greenwich MarketView. MarketView provides continuous access to these metrics, updated at least monthly, based on the frequency of the source data.
Crisil Coalition Greenwich continuously gathers data and insights from municipal bond market participants, including market makers, primary dealers and trading platforms. The data, once aggregated, normalized and enhanced, is analyzed by our market structure research team, who identify the key trends of trading in the muni markets, with a focus on muni bond electronic trading and trading platform market share.